
“Our health system is the best in the world” This is a sentence you may recognise. Depending on where you are from, you may have heard a version of it from politicians, newspapers, relatives, neighbours, or even yourself. And if you have travelled, lived abroad, or married into another culture, you will know that many countries tell themselves the same story. Every country has its own “greatest” story. We like uniqueness. Countries, like people, need stories about what makes them different.
But the way a story is framed matters. Once we frame our health system as “the best in the world”, that belief becomes a reference point. Good outcomes confirm the story; bad outcomes are easier to explain away as temporary, external, or someone else’s fault. And over the last decade, there have been several moments where this has been
visible.
Covid-19 and Brexit both showed this clearly. During the pandemic, when neighbouring countries struggled, the easy explanation was that they had done something wrong. But when our own systems were overwhelmed, the blame often moved elsewhere: imported problems, external pressure, people not following rules. Brexit used a similar frame. The NHS was placed at the centre of the campaign, with the implication that its problems came from outside: Brussels, migration, or money being diverted away. But there was much less appetite for asking whether the problem was also inefficiency within the system itself.
For decades, one of the great success stories of modern economies has been that people started living longer. Better sanitation, vaccines, antibiotics, safer childbirth, cancer treatments, heart medication, and public health campaigns have saved millions of lives. And it is true! this progress is extraordinary, and worth celebrating.
But a few days ago, we read a new report from the Health Foundation (Moony et al., 2026), that highlighted that people in the UK are now spending fewer years in good health than they did a decade ago. Healthy life expectancy has fallen from around 63 years to around 61 years for both men and women over the past decade (The Guardian, 2026). More precisely, the ONS estimates that healthy life expectancy in 2022–24 was 60.7 years for men and 60.9 years for women (ONS, 2026a).
And why is this important? Because there is a big difference between living to 84 and being healthy until 75, and living to 84 but becoming seriously unwell at 60. The first means independence; the second means treatment, dependency, cancelled plans, hospital appointments, and care needs. The current UK state pension age is 66, and it is legislated to rise to 67 between 2026 and 2028 (GOV.UK, 2025). So, on average, people may start experiencing poor health years before reaching the age at which the state expects them to retire. That is depressing personally, but also economically.
If people become too unwell to work, the economy loses workers, households lose income, firms lose experience, and the state faces higher welfare and health costs. Thus, NHS pressure is only one part of this story. Another, less visible pressure comes from the knock-on effects of poor health on the labour market: people who are not necessarily old, but are no longer healthy enough to participate fully in work, family life, or society.
This also connects directly to the UK’s productivity puzzle. Evidence shows that poor health reduces labour-force participation, hours worked and earnings (Bloom et al., 2004; Currie and Madrian, 1999), while UK evidence finds that health shocks significantly increase early retirement and labour-market exit (Jones et al., 2010). In the UK, the number of working-age people who are economically inactive because of longterm sickness rose from around 2.0 million in 2019 to around 2.8 million in 2025 (ONS, 2026b), and once people leave work for health reasons, the financial and social costs can become long-lasting (GOV.UK, 2026). So, falling healthy life expectancy is part of the wider story of weak growth, lost experience and low productivity.
So, if healthy life expectancy is falling, who should we blame now?
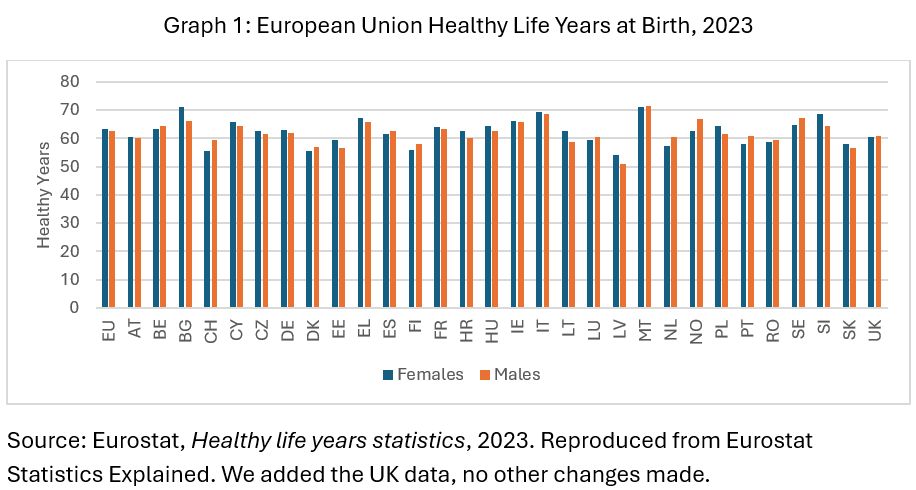
The UK is now below the European average, and yes, that should worry us. But this is not only a British story. In 2023, people in the EU could expect around 63.1 healthy life years at birth: 63.3 for women and 62.8 for men (Eurostat, 2025). Graph 1 shows large differences across Europe: from 54.3 years in Latvia to 71.1 in Malta for women, and from 51.2 to 71.7 for men. Countries make different choices, design different systems, and create different living conditions. Almost everyone has something to learn.
When we talk about pressure on health systems, we often focus on the visible crisis: waiting times, ambulance delays, hospital beds, emergency departments, and cancelled operations. These things matter, but they are often symptoms of a deeper flow problem. Prevention means reducing avoidable illness, detecting conditions earlier, managing chronic disease better, and helping people stay independent for longer. This is not separate from health-system efficiency. It is part of it.
Across countries, many hospital admissions are considered avoidable because they could often be prevented, delayed, or better managed through stronger primary care, earlier diagnosis, and better support for chronic conditions. When prevention and community care are weak, hospitals become the place where the system absorbs problems that could have been treated earlier and more cheaply (OECD, 2025a). In many cases, the emergency department is where the health system pays for prevention that did not happen.
You may immediately think about more money, but more money does not automatically mean better health. The United States is the obvious example: it spends far more on healthcare as a percentage of GDP than most western countries, yet often performs worse on access, affordability, and outcomes (OECD, 2025b; Commonwealth Fund, 2024).
That is the difference between expenditure and efficiency. The real question is not only how much a country spends, but how well it turns money, staff, hospitals, medicines, technology, and management into healthier lives.
So instead of looking for someone to blame, or competing over who has “the best health system in the world”, perhaps the better question is: how can we make our systems work more efficiently so people live healthier lives for longer? That means being less defensive, learning from what works elsewhere, and recognising that health is not a national trophy. It is a shared challenge.
References
Bloom, D. E., Canning, D., and Sevilla, J. (2004). “The effect of health on economic growth: A production function approach.” World Development, 32(1), 1–13.
Commonwealth Fund. (2024). Mirror, Mirror 2024: A Portrait of the Failing U.S. Health System. https://www.commonwealthfund.org/publications/fundreports/2024/sep/mirror-mirror-2024
Currie, J., and Madrian, B. C. (1999). “Health, health insurance and the labor market.” Handbook of Labor Economics, 3, 3309–3416.
Eurostat. (2025). Healthy life years statistics. https://ec.europa.eu/eurostat/statisticsexplained/index.php?title=Healthy_life_years_statistics
Eurostat. (2025). How many healthy life years can EU citizens expect?
https://ec.europa.eu/eurostat/web/products-eurostat-news/w/ddn-20250808-1
GOV.UK. (2025). GAD and the State Pension age review. https://www.gov.uk/government/news/gad-and-the-state-pension-age-review
GOV.UK. (2026). Keep Britain Working: Final report. https://www.gov.uk/government/publications/keep-britain-working-review-finalreport/keep-britain-working-final-report
Jones, A. M., Rice, N., and Roberts, J. (2010). “Sick of work or too sick to work? Evidence on self-reported health shocks and early retirement from the BHPS.” Economic Modelling, 27(4), 866–880.
Moony, A., Alarilla, A., and Cavallaro, F. (2026). “Healthy life expectancy trends in the UK: a watershed moment”, Health Foundation, https://www.health.org.uk/reports-andanalysis/analysis/healthy-life-expectancy-trends-in-the-uk-a-watershed-moment
OECD. (2025a). Health at a Glance 2025: Avoidable hospital admissions.
https://www.gov.uk/government/news/gad-and-the-state-pension-age-review
OECD. (2025b). Health at a Glance 2025: Health expenditure per capita.
https://www.oecd.org/en/publications/health-at-a-glance-2025_8f9e3f98-en/fullreport/health-expenditure-per-capita_affe6b0a.html
Office for Budget Responsibility. (2012). The productivity puzzle. https://obr.uk/box/theproductivity-puzzle/
Office for National Statistics. (2026a). Healthy life expectancy, UK: between 2011 to 2013 and 2022 to 2024.
https://www.ons.gov.uk/peoplepopulationandcommunity/healthandsocialcare/healtha
ndlifeexpectancies/bulletins/healthstatelifeexpectanciesuk/between2011to2013and20
22to2024
Office for National Statistics. (2026b). LFS: Economic inactivity reasons: Long-term sick: UK: 16–64:000s:SA.
https://www.ons.gov.uk/employmentandlabourmarket/peoplenotinwork/economicinac
tivity/timeseries/lf69/lm

Leave a comment